🎉 Celebrating 25 Years of GameDev.net! 🎉

Not many can claim 25 years on the Internet! Join us in celebrating this milestone. Learn more about our history, and thank you for being a part of our community!

3D Render

Started by
8 comments, last by codefreak2022 1 year, 9 months ago

I need help with the below.

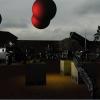
Consider the following 3D scene representing an old town's main square:
• A single statue
static geometry, high polygon count
low complexity fragment shader
• A particle system simulating smoke
animated, rendered as a large set of points
• A small set of characters
animated geometry, medium polygon count
medium complexity fragment shader
• A large set of buildings
static geometry, low polygon count
low complexity fragment shader
• A background image/skybox
• The camera/viewpoint is continuously moving within the scene.

How would you render the statue - by itself – using OpenGL to achieve maximum vertex performance (vertices/second)?

How would you render the particle system - by itself - using OpenGL to achieve maximum vertex performance (vertices/second)?

How would you render the scene - as a whole - most efficiently on a GPU using OpenGL?

Given that the 3D scene was being rendered correctly but that you wanted to improve the performance further, how would you determine if the main performance limitation/bottleneck was located in the application, in the vertex processing stage, or in the fragment processing stage?

Advertisement

codefreak2022 said:
Given that the 3D scene was being rendered correctly but that you wanted to improve the performance further, how would you determine if the main performance limitation/bottleneck was located in the application, in the vertex processing stage, or in the fragment processing stage?

Use GPU profiling tools. It's some work to set them up and to understand them, but it's the only way.

You say you have low poly characters and buildings, but a high poly statue.
This triggers me assuming that maybe the statue would look better if it was low poly as well, for a consistent artstyle.

@JoeJ Yes, I understand that we need to profile and capture logs , then analyze DRAW calls to see if any performance issues. is there any better way to render particle system, with max performance. ?

codefreak2022 said:
is there any better way to render particle system, with max performance. ?

You mention ‘set of points’, but i guess you draw a billboard quad per point.

One common optimization is to use some out of order transparency method to avoid the need for a depth sort. I remember some papers from Morgan McGuire proposing weighting approaches and showing its limitations. Seems practical, easy and probably a win.
There is also work on compute approaches regarding sorting and rasterization, true volumetric rendering using raymarching, various lighting tricks, etc. But i never came across something we would really like regarding performance.

Personally i see only one promising direction: If we had a texture space shading engine, we could cache raymarched volumetric results in texture space, so on the surface of objects behind the smoke.
Because smoke usually does not move fast, and cameras don't do either, we could eventually get realtime volumetric stuff at much lower cost and with acceptable artifacts.
But that's really just speculation. Texture space shading does not seem to become a norm anytime soon.

So, if cost of particles is too high, reducing their number seems your best option : /

Dunno how far along you are or what your materials are or the scale of the scene. Definitely profile eventually, but as a brain dump of what I’d do roughly for rendering most opaque stuff, I would generally:

  • Optimize art for minimal amount of polygons
  • Z prepass
  • Make sure Early-Z optimization is enabled for your shaders
  • Frustum culling
  • optimize the actual vertex shader(s)

and if you really need:

  • instance, batch draw calls if youre drawing say a ton of buildings
  • start LODing if possible with your camera views

and then just see what framerate you’re even dealing with after each of those. If vertices are like really a problem then id investigate stuff like impostors or some form of more aggressive culling.

Re profiling, there are a bunch of tools out there and it can be confusing to approach. I haven’t used NSight, but if you have an AMD gpu, RGP is great, it’ll tell you if you’re cpu or gpu bound right away and show you more counters than you probably care to see for gpu timings. For CPU profiling, Intel VTune will give you a ton of detail, but I think Visual Studio’s diagnostic tools can be used to locate hotspots at least. That stuff gets hard when you’re suffering death by 1000 cuts so to speak.

@jgkling How can I identify if the bottleneck was located in the application, in the vertex processing stage, or in the fragment processing stage? If I use some profiling tools, get the dump and analyze draw calls and identify which shader (vertex/fragment) it belongs to?

Speaking generally, you can soft test whether something is a bottleneck by checking how much the computation time goes down as you reduce the workload. You need a profiler that tells you, for a single draw call, roughly vertex shader time and fragment shader time, and definitely total draw time. You can also make your app really simple and only render a couple of things so it’s easy to keep track of. You can get gpu timings yourself with OpenGL I would hope to reduce your reliance on a profiler but I actually don’t know opengl that well, I’m more vulkan and some d3d12.

first thing I’d do is make the fragment shader do something dumb simple, like return float4(1, 0, 0, 1) and see what happens. if time went down that whatever you commented out was part of the problem. If not it’s something else. If that doesn’t help then you can reduce the vertex workload by using a simpler mesh (this is why LODs exist).

If that fails to get you any headway, you’ll need deeper info from the profiler. Registers used, occupancy, per instruction timing. But that stuff is harder and takes longer, and nothing in your post is particularly or extraordinarily rare as far as rendering techniques, so I’d suggest doing the easy tests and measuring frame time in milliseconds for each step and look for patterns.

I am trying to figure out ways to enhance/improve the performance here for the 3D scene which got rendered. So I need to first identify bottlenecks and then optimize it. I need to optimize in software applications as well as shader code.

@codefreak2022 I believe performance optimization can be done w.r.t memory and bandwidth usage, frame rates etc. Any thoughts?

This topic is closed to new replies.

Advertisement